Selling a complex solution is a lot like running a marathon. To
be successful, you can’t just walk up to the starting line and start
running. Success in the marathon takes months of preparation. For each
mile of the marathon, a runner might run 20-30 miles in direct
preparation. Similarly, a good enterprise sales person will dedicate
10-20 hours of preparation (research, discovery, planning) for each hour
of face to face with the prospect or customer.
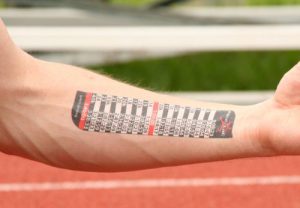
The successful marathoner will have a comprehensive race plan, mapping out the goal pace for each mile. Many apply these plans as temporary “race tats” on their arms, so that they can keep track of their plan while on the road. Similarly, good enterprise sales people develop detailed opportunity or pursuit plans that include both their actions and those of their teammates (other sales people on the account, sales engineers, etc.).
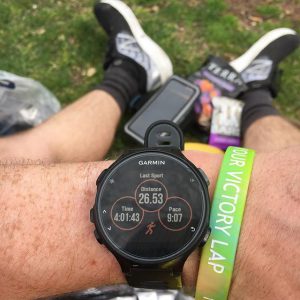
Marathoners carefully watch the leading indicators that help them to determine whether the individual race will be worthy of a Personal Record (PR) or perhaps just a long, slow run. For the runner, some of these leading indicators include their Heart Rate Variance (HRV) and sleep patterns in the days leading up to the race, the temperature and humidity on race day, how they feel at the start line and more.
 If
the racer sticks to their race plan (slower pace in the first half of
the race, faster in the second), a good day is possible. Toss that race
plan, run too fast in the first half of the race, and all the prep in
the world won’t save you. Trust me…I know!
If
the racer sticks to their race plan (slower pace in the first half of
the race, faster in the second), a good day is possible. Toss that race
plan, run too fast in the first half of the race, and all the prep in
the world won’t save you. Trust me…I know!
Similar dynamics exist in the complex enterprise sales environment. While sales management typically watches portfolio coverage as a primary indicator, it is not a leading indicator. Pipeline coverage will tell you that you are in trouble. It won’t tell you why you are in trouble…and it doesn’t give sufficient warning for early correction.
The Acelera Group Sales Productivity Framework incorporates ten rep-focused leading indicators, along with a single first line sales manager (FLSM) indicator. These indicators provide the early warning signs for a decline in sales performance, at the rep, group and region level, and point strongly to specific actions to be taken for course correction.
The ratio of prep time versus face time, as mentioned earlier, is one of these leading indicators. Depending on the specific business problem, level of prior customer intimacy and complexity of the environment, the sweet spot may be 5 or 10 to 1. When reps (or teams) diverge from the sweet spot, we can expect a looming drop in sales results.
A second leading indicator – whether a business value analysis (BVA) has been conducted – holds a similar power of predictability. Curiously, despite its significant positive impact on customer intimacy and satisfaction, deal profitability and overall sales results, the BVA is not widely used.
Complex enterprise selling should not be an ad hoc series of unrelated activities. Good preparation and effective plan execution will help the runner to complete the race and the sales rep to drive great sales results.
What are your leading indicators telling you?
Thanks!

The successful marathoner will have a comprehensive race plan, mapping out the goal pace for each mile. Many apply these plans as temporary “race tats” on their arms, so that they can keep track of their plan while on the road. Similarly, good enterprise sales people develop detailed opportunity or pursuit plans that include both their actions and those of their teammates (other sales people on the account, sales engineers, etc.).
Marathoners carefully watch the leading indicators that help them to determine whether the individual race will be worthy of a Personal Record (PR) or perhaps just a long, slow run. For the runner, some of these leading indicators include their Heart Rate Variance (HRV) and sleep patterns in the days leading up to the race, the temperature and humidity on race day, how they feel at the start line and more.
If
the racer sticks to their race plan (slower pace in the first half of
the race, faster in the second), a good day is possible. Toss that race
plan, run too fast in the first half of the race, and all the prep in
the world won’t save you. Trust me…I know!Similar dynamics exist in the complex enterprise sales environment. While sales management typically watches portfolio coverage as a primary indicator, it is not a leading indicator. Pipeline coverage will tell you that you are in trouble. It won’t tell you why you are in trouble…and it doesn’t give sufficient warning for early correction.
The Acelera Group Sales Productivity Framework incorporates ten rep-focused leading indicators, along with a single first line sales manager (FLSM) indicator. These indicators provide the early warning signs for a decline in sales performance, at the rep, group and region level, and point strongly to specific actions to be taken for course correction.
The ratio of prep time versus face time, as mentioned earlier, is one of these leading indicators. Depending on the specific business problem, level of prior customer intimacy and complexity of the environment, the sweet spot may be 5 or 10 to 1. When reps (or teams) diverge from the sweet spot, we can expect a looming drop in sales results.
A second leading indicator – whether a business value analysis (BVA) has been conducted – holds a similar power of predictability. Curiously, despite its significant positive impact on customer intimacy and satisfaction, deal profitability and overall sales results, the BVA is not widely used.
Complex enterprise selling should not be an ad hoc series of unrelated activities. Good preparation and effective plan execution will help the runner to complete the race and the sales rep to drive great sales results.
What are your leading indicators telling you?
Thanks!
